The Goal
In this section, we will go over the basics of SVG Paths and how to create them using D3.js.
The Shape to Make All Shapes
An SVG Path is capable of drawing rectangles, circles, ellipses, polylines, polygons, straight lines, and curves.
W3 defines SVG Paths as follows:
SVG Paths represent the outline of a shape that can be stroked, filled, used as a clipping path, or any combination of all three.
W3 then provides an analogy relating pen and paper roughly as follows:
- Imagine that a pen is put on a piece of paper.
- The pen will touch the paper in only one point.
- The pen is now moved to another point.
- The path between the two points can be a straight line or a curve.
- The curve can be an arc, a cubic Bézier curve or a quadratic Bézier curve.
Which means that you can use an SVG Path to make any type of SVG shape.
SVG Path Example
The shape of an SVG Path element is defined by one attribute: d.
This attribute, d, contains a series of commands and parameters in the SVG Path Mini-Language.
These commands and parameters are a sequential set of instructions for how to "move the pen over the paper".
The instructions are defined in case-senstive terms of moveto (set a new current point), lineto (draw a straight line), curveto (draw a curve using a cubic Bézier), arc (elliptical or circular arc) and closepath (close the current shape by drawing a line to the last moveto).
For example, we could draw a triangle as follows:
<svg width="100" height="100">
  <path d=" M 10 25
            L 10 75
            L 60 75
            L 10 25"
            stroke="red" stroke-width="2" fill="none" />
</svg>
The d=" M 10 25 ......" part of the SVG code above is the set of instructions we are giving our SVG Pen.
In this case (all in the SVG Coordinate System - X coordinate first, then Y coordinate):
- M 10 25 - Put the pen down at 10 25
- L 10 75 - Draw a line to the point 10 75, from the previous point 10 25
- L 60 75 - Draw a line to the point 60 75, from the previous point 10 75
- L 10 25 - Draw a line to the point 10 25, from the previous point 60 75
In summary - we tell the SVG path to put the pen down. Then draw the left hand side of the triangle. Then draw the bottom of the triangle. Then draw the hypotenuse of the triangle.
The rest of the commands (stroke, stroke-width, fill) dictate what the line looks like and what if anything is the color that is filled in.
Note - our letters (M, L) are capitalized which means that we were using absolute positioning within our SVG Viewing window. If we use lower case commands, then we will be using relative positioning.
SVG Path Mini-Language
As we saw in our example, there is an SVG Path Mini-Language comprised of lower and upper case letters.
This Mini-Language is defined as follows:
| Command | Parameters | Repeatable | Explanation |
| Pen Command | |||
| M ( m ) | x, y | Yes | moveto Move the pen to a new location. No line is drawn. All path data must begin with a 'moveto' command. |
| Line Commands | |||
| L ( l ) | x, y | Yes | lineto Draw a line from the current point to the point (x,y). |
| H ( h ) | x | Yes | horizontal lineto Draw a horizontal line from the current point to x. |
| V ( v ) | y | Yes | vertical lineto Draw a horizontal line from the current point to y. |
| Cubic Bezier Curve Commands | |||
| C ( c ) | x1 y1 x2 y2 x y | Yes | curveto Draw a cubic Bézier curve from the current point to the point (x,y) using (x1,y1) as the control point at the beginning of the curve and (x2,y2) as the control point at the end of the curve. |
| S ( s ) | x2 y2 x y | Yes | shorthand/smooth curveto Draw a cubic Bézier curve from the current point to (x,y). The first control point is assumed to be the reflection of the last control point on the previous command relative to the current point. (x2,y2) is the second control point (i.e., the control point at the end of the curve). |
| Quadratic Bezier Curve Commands | |||
| Q ( q ) | x1 y1 x y | Yes | quadratic Bézier curveto Draw a quadratic Bézier curve from the current point to (x,y) using (x1,y1) as the control point. |
| T ( t ) | x y | Yes | Shorthand/smooth quadratic Bézier curveto Draw a quadratic Bézier curve from the current point to (x,y). The control point is assumed to be the reflection of the control point on the previous command relative to the current point. |
| Elliptical Arc Curve Command | |||
| A ( a ) | rx ry x-axis-rotation large-arc-flag sweep-flag x y | Yes | elliptical arc Draws an elliptical arc from the current point to (x, y). The size and orientation of the ellipse are defined by two radii (rx, ry) and an x-axis-rotation, which indicate how the ellipse as a whole is rotated relative to the current SVG coordinate system. The center (cx, cy) of the ellipse is calculated automatically to satisfy the constraints imposed by the other parameters. large-arc-flag and sweep-flag contribute to the automatic calculations and help determine how the arc is drawn. |
| End Path Command | |||
| Z ( z ) | none | No | closepath Closes the path. A line is drawn from the last point to the first point drawn. |
As you can gather from our simple example above and the Mini-Language described above, it's a bit difficult to create SVG Paths for anything more complicated than a single line.
Which is where D3.js comes to the rescue with Path Data Generators!
D3.js Path Data Generator Line Example
D3.js includes a set of helper classes for generating SVG Path instructions.
Before we go into all of the D3.js Path Data Generators, let us look at a specific example for the line path data generator.
For a line graph, we have a sequence of x,y coordinates.
The sequence of x,y coordinates represents one line.
We need a function that will take our data and convert it into the SVG Path Mini-Language.
D3.js provides us with a Path Data Generator Function for lines:
d3.svg.line()
This Path Data Generator Function will take our data and generate the necessary SVG Path commands.
In order to convert our data to the SVG Path Commands, we need to tell the line Path Data Generator how to access the x and y coordinates from our data.
We do this by providing an accessor function to return the x,y coordinates from our data.
For each x and y combination, we need to provide an accessor function to return the x,y coordinates from our data.
We define the accessor functions which the path generator uses to produce path data:
var lineFunction = d3.svg.line()
                          .x(function(d) { return d.x; })
                          .y(function(d) { return d.y; })
                          .interpolate("linear");
This accessor function will take in the data array that is passed to D3.js and extract the the set x,y coordinates.
It will then do a linear interpolation between each point.
The result is then passed back to the SVG Path as the d attribute.
Let us look at an example:
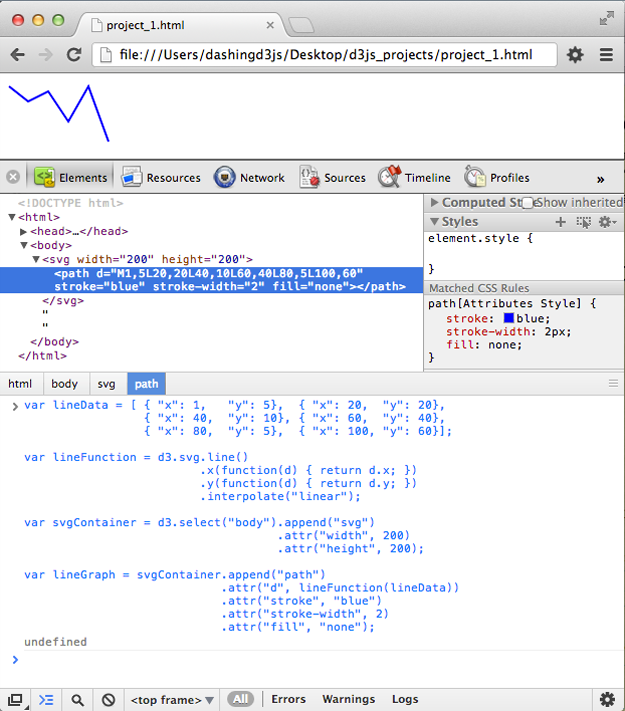
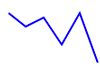
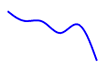
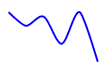
//The data for our line
var lineData = [ { "x": 1,   "y": 5},  { "x": 20,  "y": 20},
                 { "x": 40,  "y": 10}, { "x": 60,  "y": 40},
                 { "x": 80,  "y": 5},  { "x": 100, "y": 60}];

//This is the accessor function we talked about above
var lineFunction = d3.svg.line()
                         .x(function(d) { return d.x; })
                         .y(function(d) { return d.y; })
                         .interpolate("linear");

//The SVG Container
var svgContainer = d3.select("body").append("svg")
                                    .attr("width", 200)
                                    .attr("height", 200);

//The line SVG Path we draw
var lineGraph = svgContainer.append("path")
                            .attr("d", lineFunction(lineData))
                            .attr("stroke", "blue")
                            .attr("stroke-width", 2)
                            .attr("fill", "none");
Which gives us:
A couple of things to note:
- .attr("d", lineFunction(lineData)) is where the magic happens. This is where we send the data to the accessor function which returns the SVG Path Commands.
- .append("path") is used because we really only have one data object (a set of x,y coordinates), so we do not need to selectAll(), .enter(), append() like we have with other data sets.
- .interpolate("linear") is in the accessor function tells the SVG Path to draw straight lines.
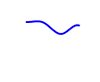
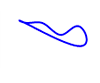
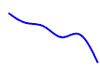
- D3.js provides 11 different types of line interpolations for the d3.svg.line() function.
-
linear - piecewise linear segments, as in a polyline.
-
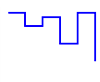
step-before - alternate between vertical and horizontal segments, as in a step function.
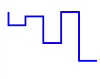
-
step-after - alternate between horizontal and vertical segments, as in a step function.
-
basis - a B-spline, with control point duplication on the ends.
-
basis-open - an open B-spline; may not intersect the start or end.
-
basis-closed - a closed B-spline, as in a loop.
-
bundle - equivalent to basis, except the tension parameter is used to straighten the spline.
-
cardinal - a Cardinal spline, with control point duplication on the ends.
-
cardinal-open - an open Cardinal spline; may not intersect the start or end, but will intersect other control points.
-
cardinal-closed - a closed Cardinal spline, as in a loop.
-
monotone - cubic interpolation that preserves monotonicity in y.
As you can see from the picture and results above, D3.js took the following data set:
var lineData = [ { "x": 1,   "y": 5},  { "x": 20,  "y": 20},
                 { "x": 40,  "y": 10}, { "x": 60,  "y": 40},
                 { "x": 80,  "y": 5},  { "x": 100, "y": 60}];
Ran it through the d3.svg.line() function with the accessor functions attached:
var lineFunction = d3.svg.line()
                         .x(function(d) { return d.x; })
                         .y(function(d) { return d.y; })
                         .interpolate("linear");
To Generate the following SVG Path (as seen in the picture in the HTML bit):
<path d="M1,5L20,20L40,10L60,40L80,5L100,60" stroke="blue" stroke-width="2" fill="none"></path>
Which is brilliant! If you look at the <path ......></path> code, you can see the Path Generator commands!
d="M1,5L20,20L40,10L60,40L80,5L100,60" => Put the pen down at the first (x,y) coordinate, then draw a line to every subsequent point.
Which is fantastic, because we can feed in as many points in the data set, and D3.js will generate the SVG Path for us that is linearly connected.
D3.js Path Data Generators
D3.js includes a set of Path Data Generators helper classes for generating SVG Path instructions.
The example above showed the line Path Data Generator:
d3.svg.line()
The path generator is both an object and a function.
Which means you can call the generator like any function and the generators will have additional methods to change its behavior.
Like other classes in D3, path generators follow the method chaining pattern where setter methods return the generator itself.
This allows for multiple setters to be invoked in a concise statement.
The generators include:
- d3.svg.line - create a new line generator
- d3.svg.line.radial - create a new radial line generator
- d3.svg.area - create a new area generator
- d3.svg.area.radial - create a new radial area generator
- d3.svg.arc - create a new arc generator
- d3.svg.symbol - create a new symbol generator
- d3.svg.chord - create a new chord generator
- d3.svg.diagonal - create a new diagonal generator
- d3.svg.diagonal.radial - create a new radial diagonal generator
Each of the generators above has specific setter and accessor functions provided by D3.js to make creating awesome paths easier.
For each of the specific SVG Path and Area Generators, there is much ground to cover before we can delve deeply into how each one works, what to take note of, and how to make it work for you.
For now, know that they exist to make your life easier and that we'll come back to them soon enough.